-- Why A Major Federal Debt Crisis Could Be a Long Way Off
Past Viewpoints:Corporations Buy Stocks As Individual Investors Sell
The widespread pessimism among individual investors stands in stark contrast to the outlook among S&P 500 executives, who bought back shares at record levels in the first quarter, and appear to have done the same in the second quarter. These insiders, who know more about future earnings growth potential than anyone else, can only be described as bullish. Despite higher borrowing costs, labor shortages, and the growing likelihood of a recession, many are coming to the conclusion that they are sitting on far more cash than is necessary to sustain operations. And some are seeing the potential return on their own company shares being greater than other opportunities for deploying capital, such as automation, paying down debt, or acquisitions.
Stock buybacks are a form of shareholder compensation. Unlike dividends, which compensate shareholders directly, stock buybacks reduce the number of outstanding shares. Other things being equal, this boosts earnings per share, because shareholders end up owning a slightly bigger slice of the company each quarter. In effect, shareholders are compensated indirectly through stock price appreciation (which is sometimes taxed at lower rates than dividends if the shares are held for more than a year).
At the end of the first quarter (the latest period for which data is available), share repurchases were $281 billion for the first three months of the year, and $985 billion for the trailing 12-month period (an increase of 97.2% over the prior 12-month period). Both figures are all-time records. According to Howard Silverblatt, Standard & Poor’s Senior Index Analyst, companies likely maintained their buyback activities in the second quarter, getting even more shares for the same expenditures, potentially providing an even greater boost to earnings per share.
Stock repurchasing activity was surprisingly widespread; 432 firms reported buyback activity in the first quarter, and 374 reported buybacks of at least $5 million. And the impact was significant, with 17.6% of firms buying back enough shares to lift earnings per share by 4% or more year-over-year. The activity was less top-heavy compared with the past, with the top 20 firms accounting for 42.1% of the dollar volume, a significant improvement over the 51.8% in Q4 and a major improvement from 87.2% in Q1 of 2021. At the current level of 42.1%, the concentration of buyback dollars is similar to that of market capitalization, which for the top 20 stocks is around 35-40%.
The top spending buyback industries were Communications Services, Technology, and Financial Services. This contrasts with the top dividend payers, which were Consumer Discretionary, Utilities, and Energy. But it was the Health Care group that saw the biggest increase over Q4, with repurchase activity rising 88.3% to $41.1 billion.
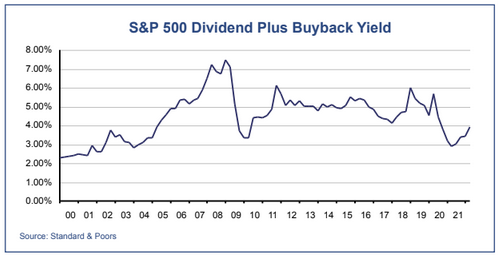
Compared with the amount of money that was paid out as dividends in the first quarter, companies spent more than twice as much on buybacks. Even over the 12 months ending 3/31/22, the S&P 500’s buyback yield was 2.74%, greatly eclipsing the index’s dividend yield of 1.63%. That made for a combined shareholder compensation yield of 4.36%. Given the recent market decline, a return to the 5% combined yield level is easily within reach for the second quarter. That level of shareholder compensation would be similar to what occurred during the nine-year period from 2011-2019. Clearly, corporate executives are continuing to reward shareholders at a healthy clip, and buybacks represent a steady stream of buying activity at a time when many individual investors have been selling.
There have been many analysts and journalists comparing the current bear market with others in the past, arguing that we still have a long way to go before the market bottoms. It’s possible they’re right, but they are ignoring the fact that buyback activity on today’s scale was not present prior to 2006, and even in 2009 it was not ramping up the way it is now.
My suggestion: take those gloomy forecasts with a grain of salt. Many growth-stock heavy-weights are pouring cash into their own stocks, so it should come as no surprise if the bear market in large-cap growth stocks ends in the near future.
Second Quarter Review
A more sobering picture of inflation emerged during the second quarter – one where labor shortages and supply-chain bottlenecks began to ease, but rising fuel and commodity costs continued to push prices higher. Alarm bells went off at the Fed, because this kind of inflation stems more from industrial capacity limitations, and can be difficult to control if it gets out of hand. Taking a page out of Paul Volker’s hawkish playbook, the Open Market Committee quickly progressed to a half-point tightening move in May, then to a three-quarter point hike in June.
The markets responded much like they did with other aggressive policy shifts in the past: stocks and bonds declined in tandem as investors shifted from worrying about inflation to worrying about the future actions of the Fed itself. The S&P 500 fell 16.1% in the second quarter, for a year-to-date pullback of 20.0%. The Barclay’s U.S. Aggregate Bond Index declined 4.7%, bringing its year-to-date loss to 10.3%, an unusually large loss for a low-risk asset class.
Our portfolios performed largely in-line with their risk scores. Our stock holdings performed slightly worse than the S&P 500 in most cases; that was due to their greater exposure to stocks in the NASDAQ Composite and Russell 2000 benchmarks (which lost 22.3% and 17.2%, respectively). Results were mixed on the bond side. High-yield bond exposure, which helped limit bond losses earlier this year, became a liability in June. In situations where we didn’t reduce high-yield bond exposure, we lost slightly more than the Barclay’s benchmark.
Outlook
For every buyer there is a seller, so when too many people want to sell, prices decline. That has been the story this year, especially with growth stocks, but the transfer of stocks from weak hands to strong hands now seems largely complete. There is still some pent-up selling potential that could come out with any new bad news that comes along, but with lower prices comes more bargain-hunting (and perhaps additional stock buyback activity). As such, the sellers seem less likely to control the market’s direction going forward.
Investors now appear convinced that the Fed will be able to bring down inflation, as evidenced by a decline in the 10-year Breakeven Rate to the 2.5% level (that’s what bond investors now expect inflation to average over the next ten years). And convincing signs of an economic slowdown are taking hold with the build-up of retail inventories and growing concerns of oversupply in the semiconductor segment. While I have been too optimistic about inflation and interest rates in the last few quarters, I still think the Fed will get a chance to take a breather from its hawkish stance later this year.
During the coming period of economic weakness, our strategy will include continuing to embrace growth stocks that have the potential to be recession-resistant, and repositioning our value holdings to gain greater exposure to buyback activity. On the bond side, we’re looking to further upgrade the quality of our bond holdings and move even further out on the yield curve.
Sincerely,

Jack Bowers
President & Chief Investment Officer