-- Why A Major Federal Debt Crisis Could Be a Long Way Off
Past Viewpoints:High Oil Prices Are Not A Long-Term Problem
In 2020, the pandemic caused oil demand to collapse globally, prompting a 7% reduction in crude production compared to 2019. That may not sound like a big plunge, but the cuts were massive; they effectively erased seven years worth of supply growth. Lacking any roadmap for forecasting a rebound, global producers raised capital to stay in business and waited for demand to pick up because it was too risky to boost production at a time of low prices.
But oil demand came roaring back in 2021, and the surge was too fast and too large for supplies to ramp up in tandem, resulting in high prices. Then came Russia’s invasion of the Ukraine, and the sanctions that followed. Not knowing how much of Russia’s oil supply could be cut off from global markets (Russian exports accounted for about 8% of global supplies until recently), producers continue to signal a conservative approach to boosting output – one that might send the price of crude toward the $120 mark (the center of oil’s trading range from 2011 and mid-2014).
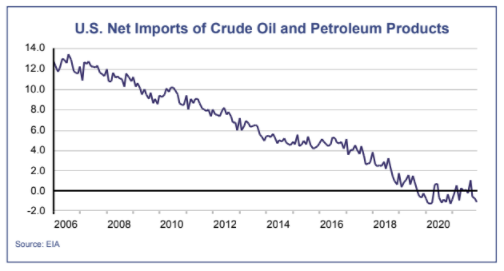
On the plus side, North American shale oil production, at nearly 9 million bpd, now exceeds what Russia exported in 2021. Additionally, North American rig counts have increased by more than 60% over the last year, so output is growing at a healthy clip too. The upshot: this price jump is unlikely to last as long as it did 2011-2014, when the shale industry was only in its infancy, and the U.S. was far more dependent on imported oil (see chart below).
On top of that, fully-electric vehicle sales are surging. This year, Battery Electric Vehicles (cars without tailpipes are known as BEVs) are expected to account for roughly 5% of vehicles sold in the U.S., at least 10% of European sales, and nearly 20% of Chinese sales. This suggests global gasoline demand may have already topped out, and that a peak in global oil demand may only be a few years out. Even with the rising cost of battery materials relegating most BEVs to the luxury auto segment, it seems unlikely that the fast-growing sales trend will abate.
Some investors remain concerned the electrical grid could get overwhelmed by a rapidly growing fleet of BEVs, but most electric utilities are welcoming and encouraging BEV owners. Most will charge their cars at home, with time-of-use rates encouraging them to do so at night when grid demand is only about one-third as great as daytime peaks. Some utilities are installing stationary batteries that can charge at night and deliver additional power during the day, eliminating the need for new transmission lines or additional power generation. Wind and photovoltaic solar installations, which are the least costly and fastest-growing source of new generation, will also play a role, and some of the consumers who buy BEVs will install rooftop solar. But even if natural gas remains the primary source of grid power, it’s still a winning game: a BEV that uses electricity from a modern three-stage natural gas power plant is able to drive twice as far as a natural gas vehicle that burns the same quantity of fuel directly. That’s because the conversion efficiency of the power plant is more than double that of a natural gas engine in a vehicle. You can even charge a BEV from a diesel generator and get mileage comparable to a diesel version of the car (that’s been done in some remote parts of Australia).
As for charging infrastructure, it’s mainly needed for road trips and where charging at home is not an option. The U.S. has about 120,000 gas stations and may ultimately need about the same number of fast-charging stations. The car companies and the electric utilities are already pushing ahead on that front, with Tesla and VW spending the most on infrastructure (the capital cost of a charging station is about 3-4 times lower than that of a gas station). With or without government support, this is not likely to be a major hurdle regarding the adoption of BEVs.
On average, the energy cost to drive a mile in a BEV is 50-75% less than a similar gasoline model, roughly reflecting a factor of 3 improvement in energy efficiency (75% of the energy in gasoline becomes waste heat; the remaining 25% moves the vehicle). Sometime over the next decade, that cost advantage is likely to dynamically limit how high oil prices can go. Why? Currently the average internal combustion vehicle is parked 95% of the time. Once BEVs become 10% of the world’s vehicle fleet, they’ll have potential to handle up to 40% of all miles driven. In a scenario like that, oil must stay competitively priced, or gasoline vehicles could end up being parked 98% of the time. In other words, gasoline’s inelastic demand curve may be fundamentally and permanently altered.
First Quarter Review
It was a challenging quarter, to say the least. The Omicron surge in January idled 5-10% of the U.S.
workforce, but had little effect on consumer spending, setting the stage for a new round of supplychain
problems. Russia’s invasion of Ukraine prompted economic sanctions on Russia which in turn
drove up the price of oil and other commodities (including agriculture). That boosted long-term
inflation expectations, prompting Fed chair Jerome Powell’s hawkish shift.
The resulting correction weighed heavily on growth stocks, leaving value stocks relatively unscathed. Bond losses were initially limited, but after the price of oil surged the bond market became more worried about inflation, and continued to suffer stinging losses even as bargain-hunting gave a lift to stocks in the final weeks of the quarter.
The S&P 500, which was supported by 40% gains in the energy sector, finished the quarter with a relatively modest decline of 4.6%. Other stock indexes with less energy exposure and greater growthstock emphasis lagged by several percentage points: the Russell 2000 finished with a 7.5% loss, and the NASDAQ was down 8.9%. On a risk-adjusted basis, things were more ugly on the bond side. As the Fed progressively put all of its tightening-cycle cards on the table, yields surged and the yield curve flattened, causing the Barclay’s Aggregate U.S. Bond Index to plunge 6.2% for the period.
Our portfolio results disappointed for two main reasons. First, our blended stock-bond models did not realize diversification benefits because both stocks and bonds suffered losses during the threemonth period. Second, most of Fidelity’s growth-oriented fund holdings were hit relatively hard. In January, we made some defensive moves in our more aggressive portfolios to limit our overall risk, which helped in some cases. Then near the end of the quarter, as stocks showed signs of recovery, we increased our growth-stock exposure in our sector model.
Outlook
Even with the latest oil price surge factored in, bond investors still don’t see inflation exceeding 3%
per year over the next decade, as evidenced by the 10-year breakeven rate (a measure that is calculated by looking at yield differences between traditional and inflation-indexed Treasuries). If the bond
market is correct, today’s elevated year-over-year inflation readings could return to near-normal
levels faster than stock investors expect – perhaps dropping below 5% in the next 12 months. This
may occur against the backdrop of a flat/inverted yield curve, which threatens a recession. But we
can see a scenario where business investment, robust consumer spending and low unemployment
keep GDP growth positive. Unlike past yield curve distortions, bank lending is less important these
days, because many businesses and consumers are sitting on excess cash and don’t need to borrow.
As such, we think the worst may be over for bonds, so we’re looking to move further out on the yield curve where future Fed tightening moves could have a less negative effect (or even a slight positive effect) on bond pricing. On the stock side, a flat/inverted yield curve, coupled with lower inflation and slower but positive GDP growth, would tend to favor growth stocks. If that scenario continues to look likely, we’ll be looking to trim some of our value-oriented fund holdings in portfolios that currently favor value over growth.
Sincerely,

Jack Bowers
President & Chief Investment Officer