-- Why A Major Federal Debt Crisis Could Be a Long Way Off
Past Viewpoints:Demographic Backdrop Turning Favorable For Stocks
Eighteen years ago, Baby Boomer 401(k) accounts were seeing robust stock fund contributions. But as this segment of the population edged closer to retirement, inflows began to shrink. Five years ago those accounts flipped over to net outflows, and they’ve remained that way ever since.
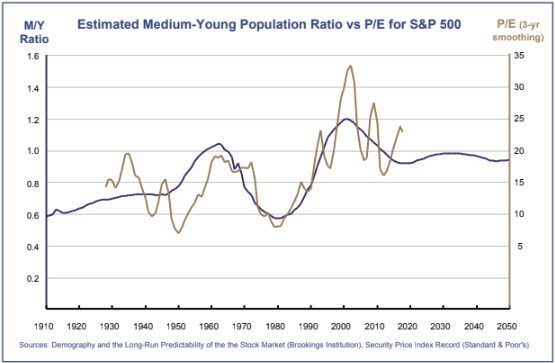
This shift comes as no surprise to the developers of the M/Y ratio, an indicator that compares the size of the nation’s biggest saving group (those aged 40-49) to the ranks of the biggest spenders (those aged 20-29). As Boomers aged out of the former group and Millennials into the latter, aggregate demand for stocks declined among individual investors, putting downward pressure on P/E ratios. Without the help of corporate stock buyback programs, the S&P 500’s 7.1% annual return for the last 18 years might have been even worse.
Fortunately, we’re now at a turning point. The Millennial population has swelled to roughly 73 million, eclipsing even the Boomer population which is now down to about 72 million. While the Millennials’ income potential was delayed by the Financial Crisis, today they’re making up for lost time. According to Fidelity’s 401(k) data, Millennials are more committed than the Boomers when it comes to saving for retirement. And because many were affected by the Financial Crisis, saving is likely to remain a top priority, taking precedence over living space.
The mass media has worked hard to create a perception that Millennials are unemployed or saddled with huge amounts of college debt. In reality, most have jobs and some 30% have no college debt at all. Among those that do, the average student loan balance is $25-30k. Those who graduated and took jobs are not having much trouble servicing their debt, which (relative to income) is comparable to the burden many Boomers had with their first car loan (a somewhat mandatory expense back in the day when the only cost-effective ride-sharing option was hitchhiking). As for the 20% or so of Millennials who have not moved out of the nest, the money saved on housing leaves more to contribute a 401(k), and many are doing just that.
Additional Background on the M/Y Ratio
The indicator was developed in 2004 as part of a study by the Cowles Foundation for Research in Economics (co-authored by John Geanakoplos, Michael Magill and Martine Quinzii). The authors found surprisingly close correlation with the stock market’s P/E ratio. In addition, the ratio may also be inversely predictive for interest rates – whenever a large population of 20-29 year-olds needs capital for education and housing, there is usually less capital available to invest in corporate bonds. Because the M/Y ratio is based on relatively stable population trends, it’s easy to project the indicator a long way into the future with high confidence.
Where We’ve Been
As shown in the chart above, U.S. demographics have created a headwind for the stock market since 2001, when the Boomers began pulling back from their peak stock-market investing years, adopting a lower-risk approach ahead of retirement as they moved out of the “M” category. At the same time, their children began to enter the "Y" category. The ranks of Gen-Xers turning 40 were too small to make up the difference, resulting downward pressure on P/E ratios. While there were some big events (Tech Bust; Financial Crisis) that might have prompted some Boomers to permanently abandon stocks, the demographic trend was probably the dominant one that weighed on returns over the last 18 years.
Where We’re Going
We’re currently in a neutral period where Boomers no longer have much impact on the ratio. That makes sense given that a large majority have reined in risk for retirement and are comfortable with their current positioning. Going forward, stock market inflows from Millennial savers should grow with each passing year, setting the stage for moderate P/E expansion over the next 15 years.
The M/Y ratio does not address generational differences when it comes to investment style. Even with a slight tailwind, the stock market could still see rising volatility as Millennial investors favor technology disruptors over traditional firms (we’ve seen some of this already). Also, to the degree that sustainable investing becomes more popular among Millennials than socially- conscience funds were among Boomers, obscure scoring systems that are largely in the eye of the beholder could have growing impact on stock values as investment rating committees periodically revise their subjective judgments.
Stock Market Implications
We’re entering a 15-year period where demographics may be creating a favorable backdrop for stocks. In contrast with the last 18 years, U.S. stock valuations are less likely to be weighed down by declining interest among individual investors. Of course, we’ll still see corrections and bear markets. And, as always, stocks will be valued primarily on their expected future earnings – which will fluctuate. But for retirement investors seeking the healthy levels of real growth that only stocks can provide, the next decade-and-a-half seems unlikely to disappoint.
First Quarter Review
Stocks bounced back in the first three months of the year, largely recovering their fourth-quarter losses. Bargain-hunting activity was tepid at first, but grew as fourth-quarter earnings reports came in ahead of lowered expectations, making it clear that fear and tax-loss selling had greatly magnified the fourth-quarter selloff. The rebound intensified as the Fed formalized its widely anticipated plan to put rate hikes on hold. It was also helped along by a deal to end the government shutdown and from progress on trade talks with China.
For the quarter, the S&P 500 jumped 13.6%. Beaten-down technology issues led the rebound, allowing some of our more tech-heavy stock portfolios to outperform. Most of our blended portfolios also benefited from rebalancing moves we made in January, which brought stock allocation percentages back up to neutral levels. Early in the quarter we boosted small-cap exposure in our non-sector portfolios, with mixed results.
The Barclay’s Aggregate Bond Index rose 2.9% during the three-month period. Bonds don’t usually rise in tandem with stocks, but in this case improving credit conditions - along with the Fed’s shift to a neutral stance - made it a rewarding quarter. The bond side of our portfolios benefited from a heavy focus on investment-grade corporates, which outperformed government debt and allowed us to finish ahead of the Barclay’s Index.
Outlook
The stock market still is still reacting negatively to the threat of a sustained yield-curve inversion, with small-caps bearing much of the burden. The forward P/E ratio for the Russell 2000, currently running about 16, is at parity with the S&P 500 despite expectations of faster earnings growth among smaller stocks. In addition, the Russell index’s price-to-sales ratio (roughly 1.2) is only about 60% as great compared to the S&P 500. The somewhat pessimistic valuation for small-caps comes at a time when smaller firms are shedding their dependence on traditional bank financing, casting doubt on the theory that inverted yield curves cause recessions. Furthermore, their revenue streams are less impacted by the slowdown in foreign economies (the Russell 2000 firms derive some 80% of revenue from domestic customers, versus about 60% for S&P 500), which should be an advantage for the current environment. Accordingly, we’re sticking with the overweighted small-cap index position in our non-sector portfolios for now. If our view is not validated by improving earnings reports in upcoming quarters, most likely we’ll move up in capitalization to the mid-cap segment.
As for the rest of 2019, we see it as neutral-to-positive. Much of the uncertainty that drove investors to sell stocks in late 2018 has been put to rest, and it’s within the realm of possibilities that the Fed could cut short-term interest rates before the year is out. Earnings growth among technology disruptor firms remains robust, and those same firms continue to exert downward pressure on inflation by creating abundance out of scarcity (a surge in new age transportation services is the latest example). Slowing growth in Europe remains a concern, as there is little the European Central Bank can do to offset it. Still, we don’t see the E.U.’s economic malaise having a big impact on domestic corporations, and our exposure to foreign stocks was minimized late last year. Bond-wise we remain optimistic that our corporate bond holdings will continue to benefit as default risk declines and credit spreads narrow.

Jack Bowers
President & Chief Investment Officer
P.S. As always we appreciate your feedback. If there is anything we can do to improve your experience as a valued client we’d like to hear from you. In addition, we are accepting new clients this quarter. If you have a friend, colleague, or family member whom you think might benefit from our service please let us know.